Each of the Group’s activities (industrial facilities, fuel storage facilities, offices) sets annual measurable targets for improving its performance in terms of Health and Safety. The performance, against set targets, is reviewed on a monthly and annual basis, and the relevant report is presented to the Management.
In addition, HELLENIC PETROLEUM participates in the European Organization CONCAWE’s annually conducted survey benchmarking for accidents.
In 2016, over a total of 8,461,862 man-hours worked, 20 lost workday injuries occurred (achieving a 20% decrease vs. 2015) concerning personnel and contractors either employed in the Group’s refineries/chemical plants or in the EKO marketing company.
Number of incidents based on CONCAWE’s definitions
|
FACILITY
|
HELPE (BEA, BEE, ΒΕΘ)
|
Headquarters
|
ΕΚΟ
|
DIAXON
|
ΑSPROFOS
|
HP CYPRUS
|
OKTA
|
EKO Serbia
|
EKO Bulgaria
|
JUGOPETROL
|
|
Lost Workday Injuries or LWIs (M/F)
|
20 (16/4)
|
0
|
0
|
3 (3/0)
|
0
|
0
|
6 (6/0)
|
0
|
0
|
0
|
|
Lost Workday Injuries (HELPE employees/contractors)
|
14/6
|
0
|
0
|
1/2
|
0
|
0
|
6 /0
|
0
|
0
|
0
|
|
Fatalities (M/F)
|
0
|
0
|
0
|
0
|
0
|
0
|
0
|
0
|
0
|
0
|
|
1 Medical Treatment Cases or MTC (M/F)
|
5 (5/0)
|
0
|
0
|
3 (3/0)
|
0
|
0
|
0
|
0
|
0
|
0
|
|
Restricted Workday Injuries or RWI (M/F)
|
6 (6/0)
|
0
|
0
|
0
|
0
|
0
|
0
|
0
|
0
|
0
|
|
LWIF (M/F)
|
3,48*
|
0
|
0
|
13,01 (13,01/0)
|
0
|
0
|
7,92 (7,92/0)
|
0
|
0
|
0
|
|
LWIS (M/F)
|
29,45*
|
0
|
0
|
36 (36/0)
|
0
|
0
|
80,83 (80,83/0)
|
0
|
0
|
0
|
|
AIF (All Injury Frequency) (M/F)
|
5,39*
|
0
|
0
|
26,03 (26,03/0)
|
0
|
0
|
7,92 7,92/0)
|
0
|
0
|
0
|
|
Occupational Diseases Rate ( / 106 hours)
|
0
|
0
|
0
|
0
|
0
|
0
|
0
|
0
|
0
|
0
|
|
2 Occupational Diseases Rate (%) (M/F)
|
*
|
-
|
0,94/ 2,75
|
2,88/ 0,98
|
-
|
-
|
8,71/9,33
|
0,41/ 2,29
|
1,02/ 0,94
|
-
|
|
1 Cases concerning first aid are not included.
2 Absences due to every type of incapacity are included (illness, accident).
* More information concerning area and gender is presented in indicator G4-LA
|
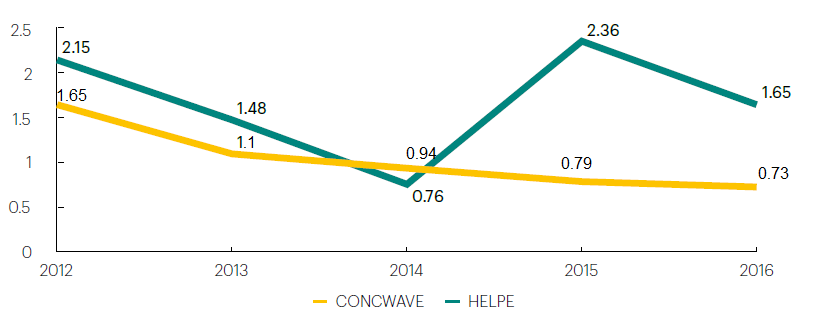
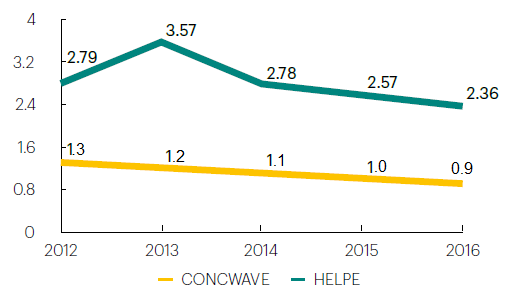
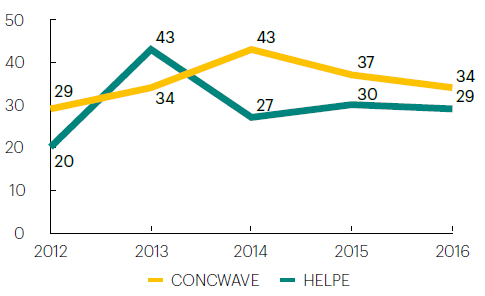
The charts below present the evolution of the most significant incident indicators in the Group’s facilities, compared with the corresponding CONCAWE indices over the last five years.
35% of lost workday accidents concerning HELPE & EKO employees, were due to slips, trips and falls on the same level.
In 2016, all indicators decreased compared to 2015.
AIF index
LWIF Index
LWIS Index
HELLENIC PETROLEUM was one of the first companies (globally) to adopt and monitor the new process safety performance indicators, in accordance with CONCAWE’s instructions and in line with API RP 754, 2010 (Recommended Practice 754 “Process Safety Performance Indicators for the Refining and Petrochemical Industries”).
Process Safety Events based on CONCAWE’s definitions
|
FACILITY
|
HELPE (ΒΕΑ, ΒΕΕ, ΒΕΘ)
|
ΕΚΟ
|
ΟΚΤΑ
|
|
Process Safety Event (PSΕ-1)
|
8
|
0
|
0
|
|
Process Safety Event (PSΕ-2)
|
6
|
0
|
2
|
|
Process Safety Event (PSΕ)
|
14
|
0
|
2
|
|
Total PSΕR index
|
2.44
|
0
|
2.64
|
The diagram below shows the evolution of the Process Safety Event Rate (PSER), which corresponds to the number of process security accidents occurred in one-million man-hours, compared to the corresponding CONCAWE index. The indicator showed a significant 30% reduction in 2016. To reduce these indicators, an annual target of minimizing process security events is set in all facilities with the ultimate goal of zeroing them.
Total PSER index